Introduction
The Sliced View tab displays an alternative "sliced" view of items selected in the Main View. It displays the same data as in the Main View but compresses genes models by trimming introns.
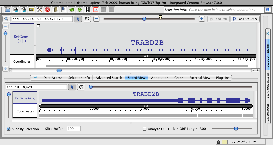
Sliced view example (click to enlarge)
Using Sliced View
- Click the Slicked View tab to make it the active bottom tab
- For maximum usefulness, open the Sliced View tab in a separate window (Tabs > Open Current Bottom Tab in New Window)
- Click a gene model in the Main View
- Observe the same gene model shown in the Sliced View but with compressed intronic regions
- Note that the Coordinates track in the Sliced view are relative to the start of the Sliced View region; they don't indicate absolute genomic coordinates.
Sliced View options
Slice by Selection
Slice Buffer
The Slice Buffer setting controls the size of introns drawn in the Sliced View display.
Analyze ORFs
Check this option to activate display of ORFs (open reading frames) underneath the Sliced View coordinate axis* track.
Min ORF Length
IGB may take a few moments to display the sliced region. For easy comparison, the sliced view displays sliced versions of all annotation tracks and graphs in the region being viewed. Use the zoom and scroll bars to navigate in the sliced view panel. Note that the numbers in the Coordinates track in the sliced view panel indicate scale; they don't correspond to genomic coordinates. Endpoint matching in the upper and lower windows are independent of each other.
Viewing deletions and insertions
The Sliced View can help you see where sequences present in one transcript are absent from the others due to alterantive splicing.
To examine alternate splicing using the Sliced View
- select one of the transcripts in the Main View
- observe insertion icons IGB draws on the other transcripts
The following images illustrates this.
In the first image, the arrows show how IGB draws regions where an annotation is 'inserted'; the introns in 'non-inserted' tracks are elongated over the region of insertion.

In the next image, the bottom-most transcript was selected in the main view. The other three transcripts each include one or more exons that were present in the top transcript. The locations of these "sliced-out: (deleted) exons relative to the other exons is indicated with X marks (red boxes). The exons that are 'shorter' than the matching exon in the selected track are drawn shorter (blue box).

You can stop the Sliced View from updating when you click items in the Main View by deselecting the Slice by Selection checkbox. This will stop the Sliced View from jumping around as you click in the Main View.
Showing ORFs and stop codons
The Sliced View panel can show open reading frames and stop codons.
To visualize open reading frames and stop codones
- select an annotation in the Main View
- click the Sliced View tab
- check the Analyze ORFs checkbox
- use the Min ORF slider to adjust the mininum length of ORFs to show (in base pairs)
The Slice Buffer is set to '0' to remove introns (red box) when the Analyze ORFs box is checked.
Three rows of ORFs appear for + translations (blue box), and for each - translation (purple box). Stop codons are red hash marks, and the reading frames are marked as green lines. The color of the stops, the ORFS and the background can be changed using Preferences > Other Options (see Other Options).
