New Features for 6.6
Welcome to IGB 6.6! (Did you see our new welcome screen?) We have made many changes and improvements to make IGB even easier for users. Many changes, such as the Data Panel redesign and the Preference tab Changes are immediately obvious, but there are many more new and exciting functions you should explore.
Redesign of the Data Access Panel
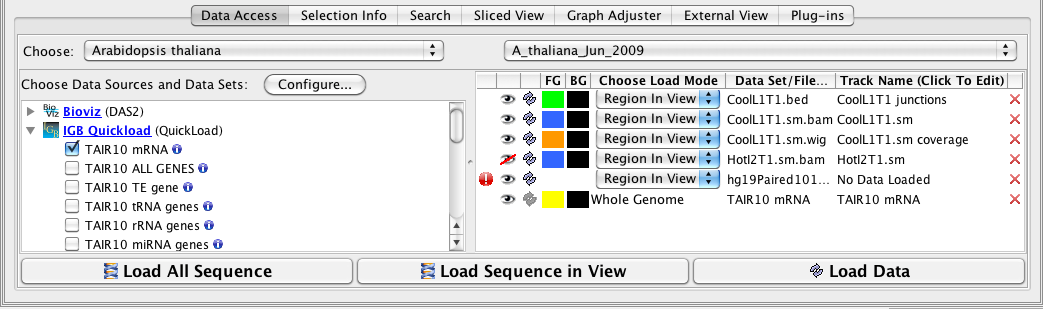
The Data Access panel has been redesigned to allow users to easily change the foreground and background colors, plus change the name of the track. The Delete icon (trashcan) and the Reload icon (arrows) are joined by the Hide icon (open eye); Hide can be used to hide tracks from view in the main window without deleting the track. A new warning icon indicates when your more recent Load Data request failed to add anything to the display.
More subtle is a new feature affecting the Data Sources tree; you can now remove an track in the display by clicking its checkbox in the Data sources and Data Sets panel.
if loading a file is taking too long (or it might fill the memory) a user can stop the loading process by using the X box at the bottom of the main window.
Here is a close-up of the redesigned Data Access panel showing the 'No Data!' alert, the Hide function activated (red line through eye), the color change options, and the now-editable Track Name column.
New Options for Changing Track Appearance
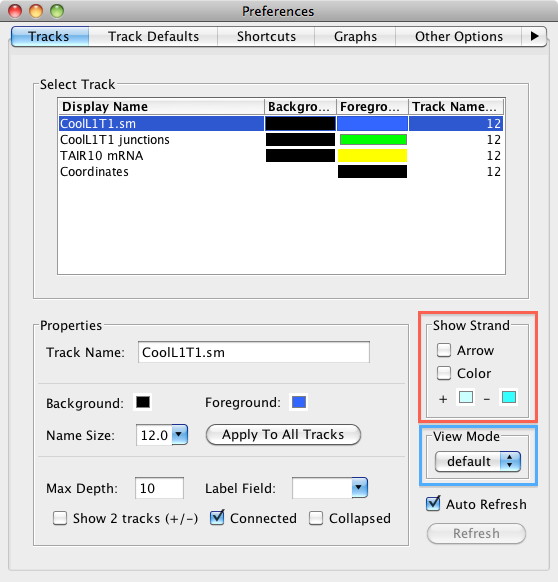
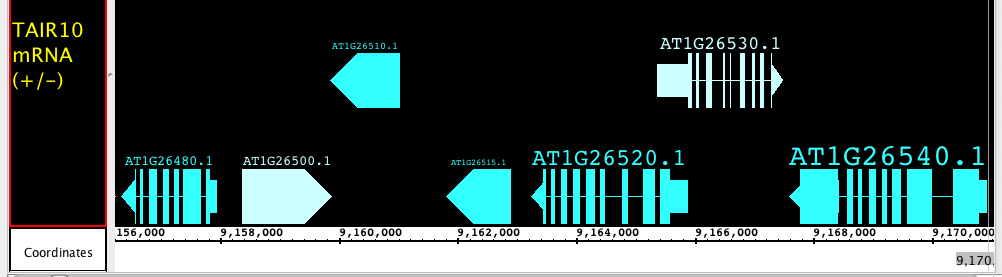
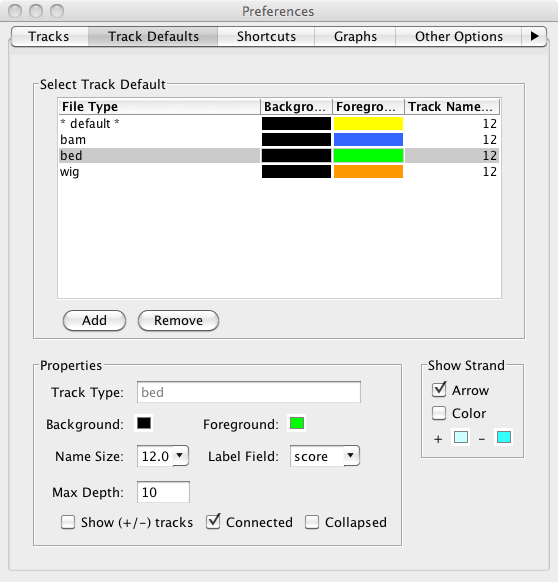
Including the redesign of the Data Access panel, we have made changing the style of a track much simpler and we have expanded the track appearance options. Track parameters can be changed through the right-click on the label menu (current method), Data Access panel (new) or the newly enhanced Tracks tab in the Preferences panel. The Tracks tab now has many great features to help you adjust the presentation of the tracks. As always, colors, name, track depth and label field can be accessed, but in addition, users can now change the font size of labels, or highlight strand differences (see red box in the image below). This is a new set of feature which allows the user to show direction of gene models. The options include Arrow, which uses an arrow head to indicate direction of transcription, and Color, which uses 2 colors (can be changed) to indicate + or - strand. This feature is an excellent way to show strandedness when + and - strands are shown as a single track (see second image).
Prototype: View Mode
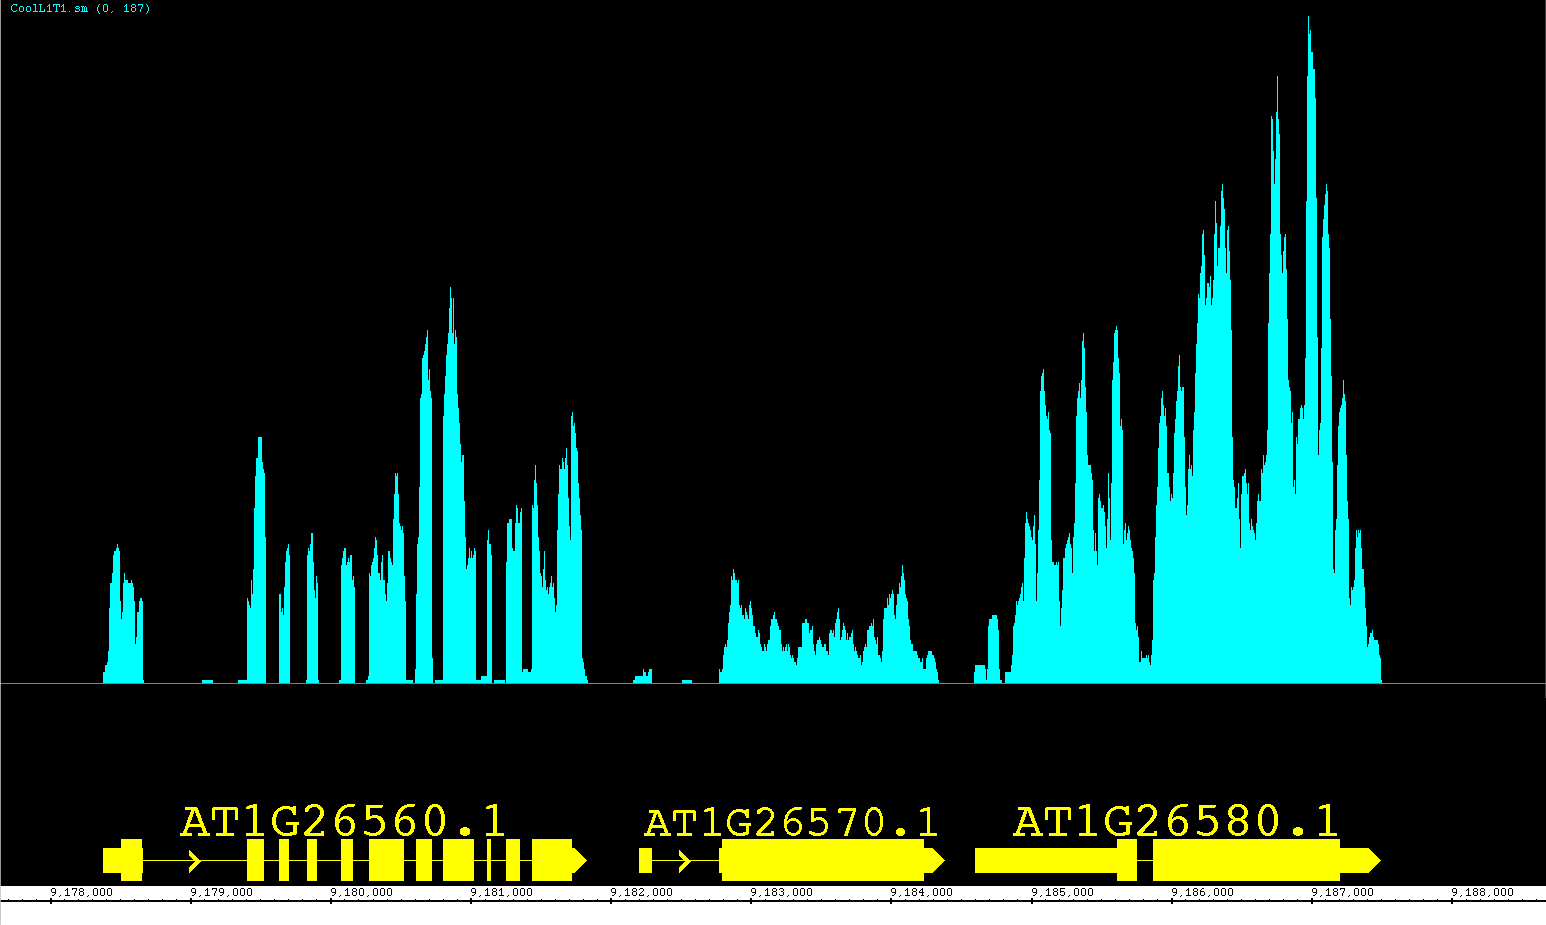
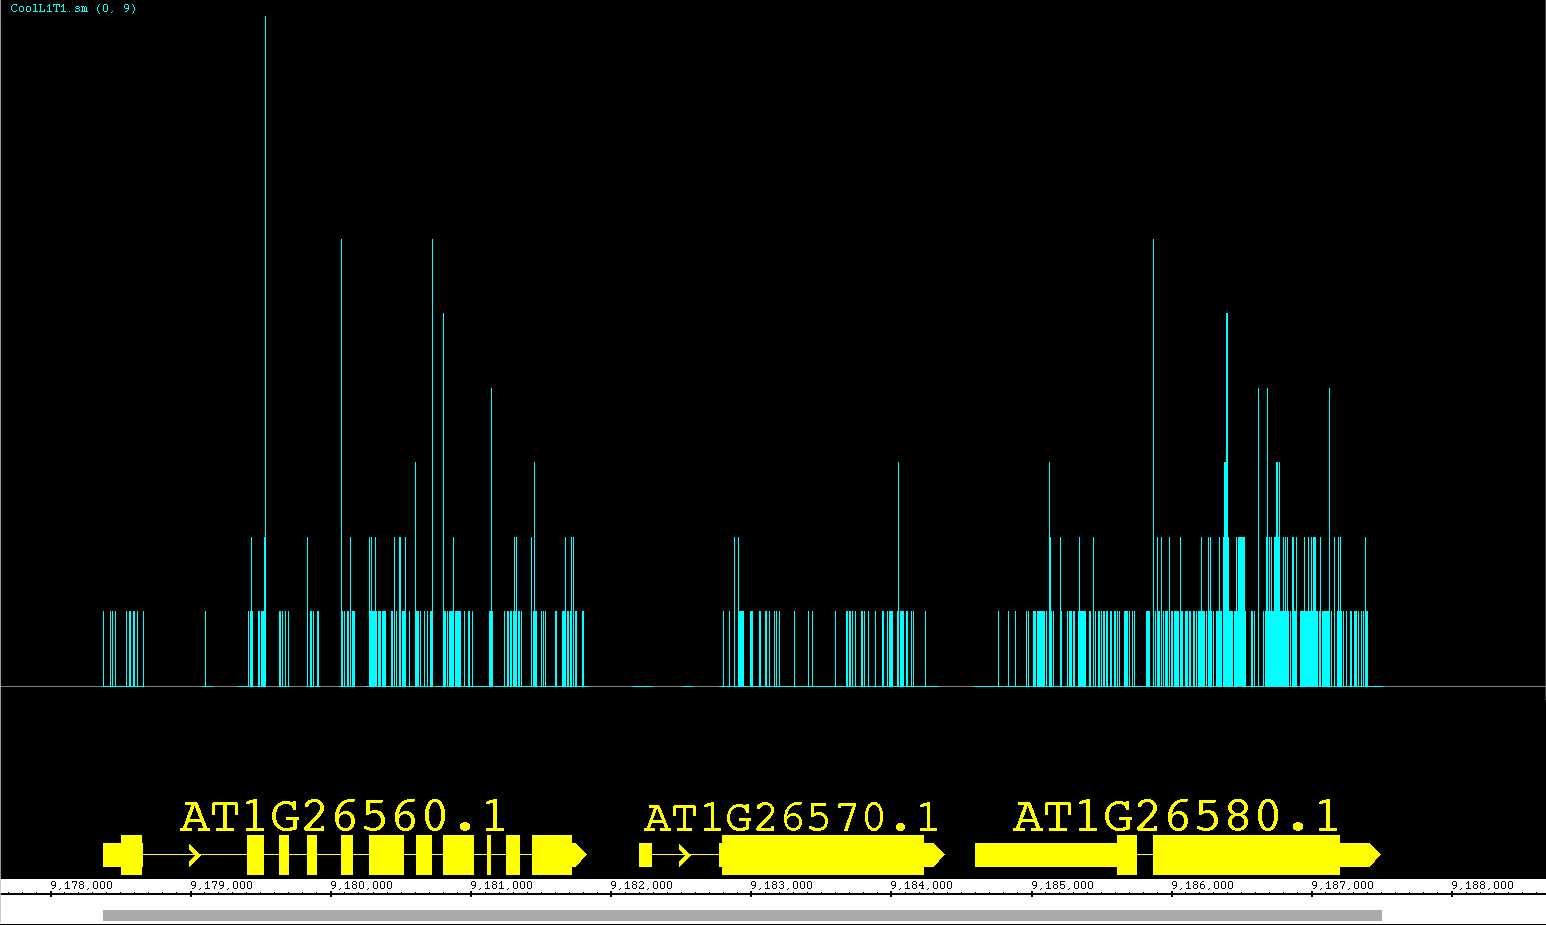
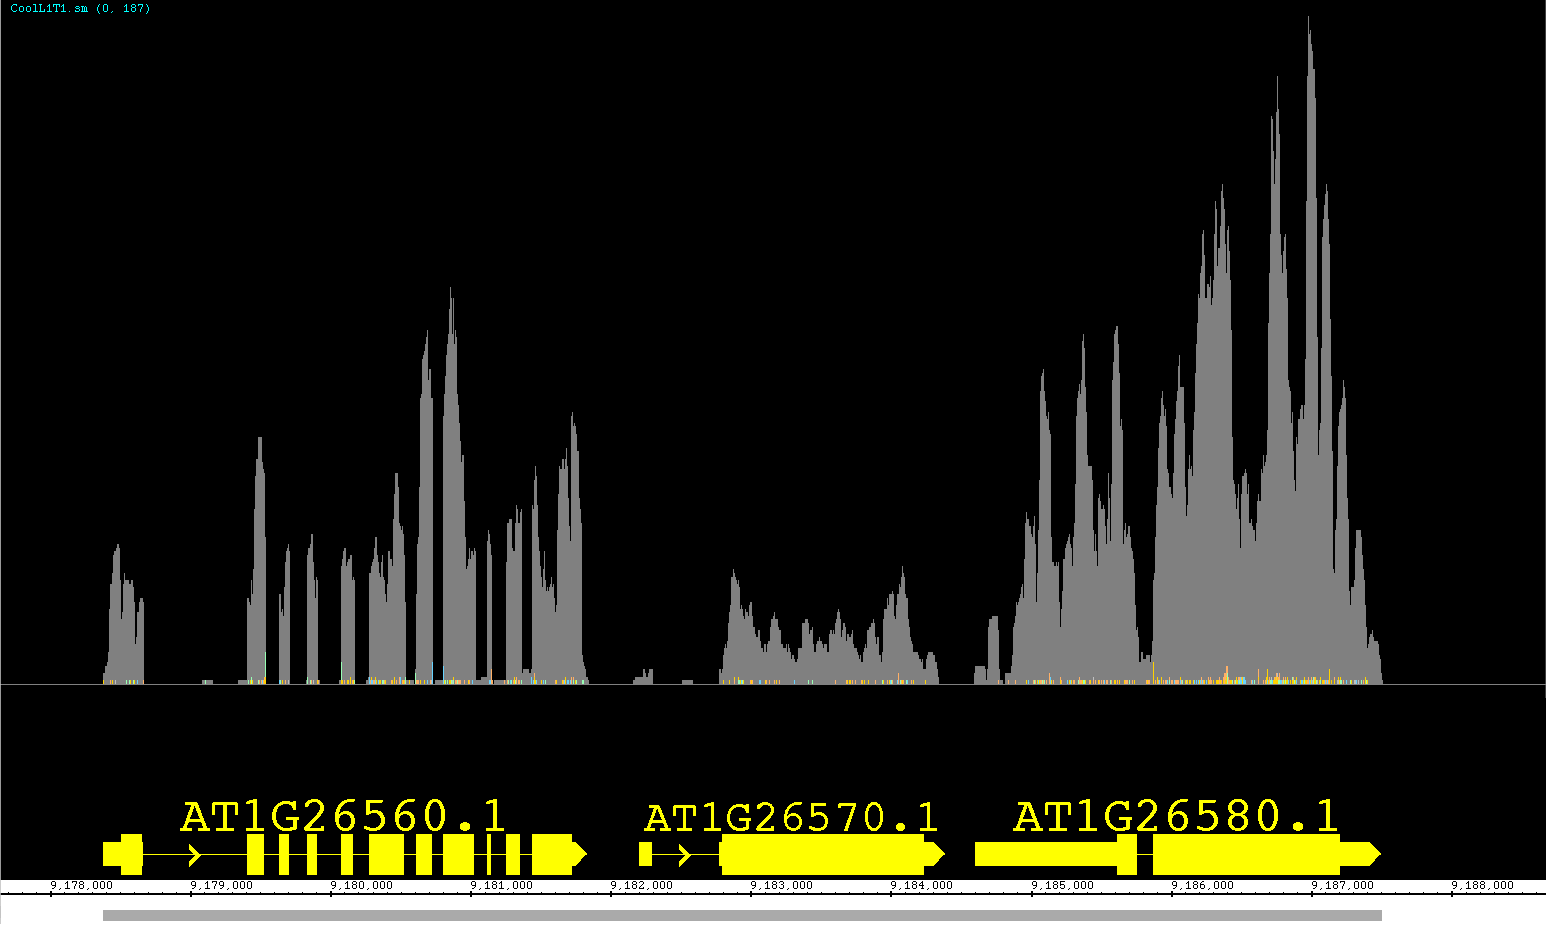
We have been developing a fantastic new feature called View Mode. We have been so pleased with this feature we are releasing it as a prototype with version 6.6. This feature allows you to get more information out of your annotation tracks without having to create several independent graphs! Accessible from the right-click menu or the Preferences >Tracks tab, you can set an annotation track to show depth, as if you created a depth graph. For BAM files you can change the View Mode to show mismatches as if it were a mismatch graph. We have also introduced a new view (also available as a Create Graph option) called Mismatch Pileup; this new function highlights mismatches (color coordinated to each nucleotide) overlayed on a dark gray depth graph, giving a lot of information compacted into a single track. Unlike graphs, you can readily change the view options at will, getting graphical information and returning to a default representation if you choose. As we continue to expand this feature, it will gain more options for adjusting the graphical display and possibly even additional views! Feel free to contact us with your ideas.
The pictures below show Default view, Depth view, Mismatch view and Mismatch Pileup view.
Improved Preference Tabs
Almost all of our Preferences tabs have been redesigned to make easier to use. This includes the incredibly expanded functions of the Tracks tab (see Track Appearance below for details), the simplification of the Other Options tab, and the addition of source ordering buttons in the Data Sources (see Faster Performance below for details). We have also created the entirely new Track Defaults tab where you can now set the default colors, font size, label, max depth and strand determination for different annotation file formats. You can also set the colors and label size for different graph file types.
New Features for the Main View
There are many new and improved features to enhance the main view in IGB. We have made the Zoom Stripe translucent so that you can easily see your data at the same time you can see point of focus, but both the Zoom Stripe Label and the Zoom Stripe itself can be turned off from the View menu. Another fantastic feature accessible from the right-click menu is the Focus On Selected Track option, which will allow the user to 'zoom in' and fill the viewable space with the track of interest. We have also changed the sequence to a dynamic font which both allows you to zoom in on the track just a little more and increases visibility of each nucleotide. By installing the MergeAnnotationOperator Plugin, you can now join annotations into a single track, just as the Join function works for graphs.
Prototype: Track Height Adjustment
Here is another experimental function that was just too useful to leave out! You can now adjust the track height for annotation and graph tracks. Move the cursor over the boundary between two track labels until the height adjustment cursor icon appears. Click and drag to the new height. As this feature is still under development, it may exhibit some quirky behavior, but we found it to be so useful overall that we included it with this release. Look for this feature to be even better in future releases!
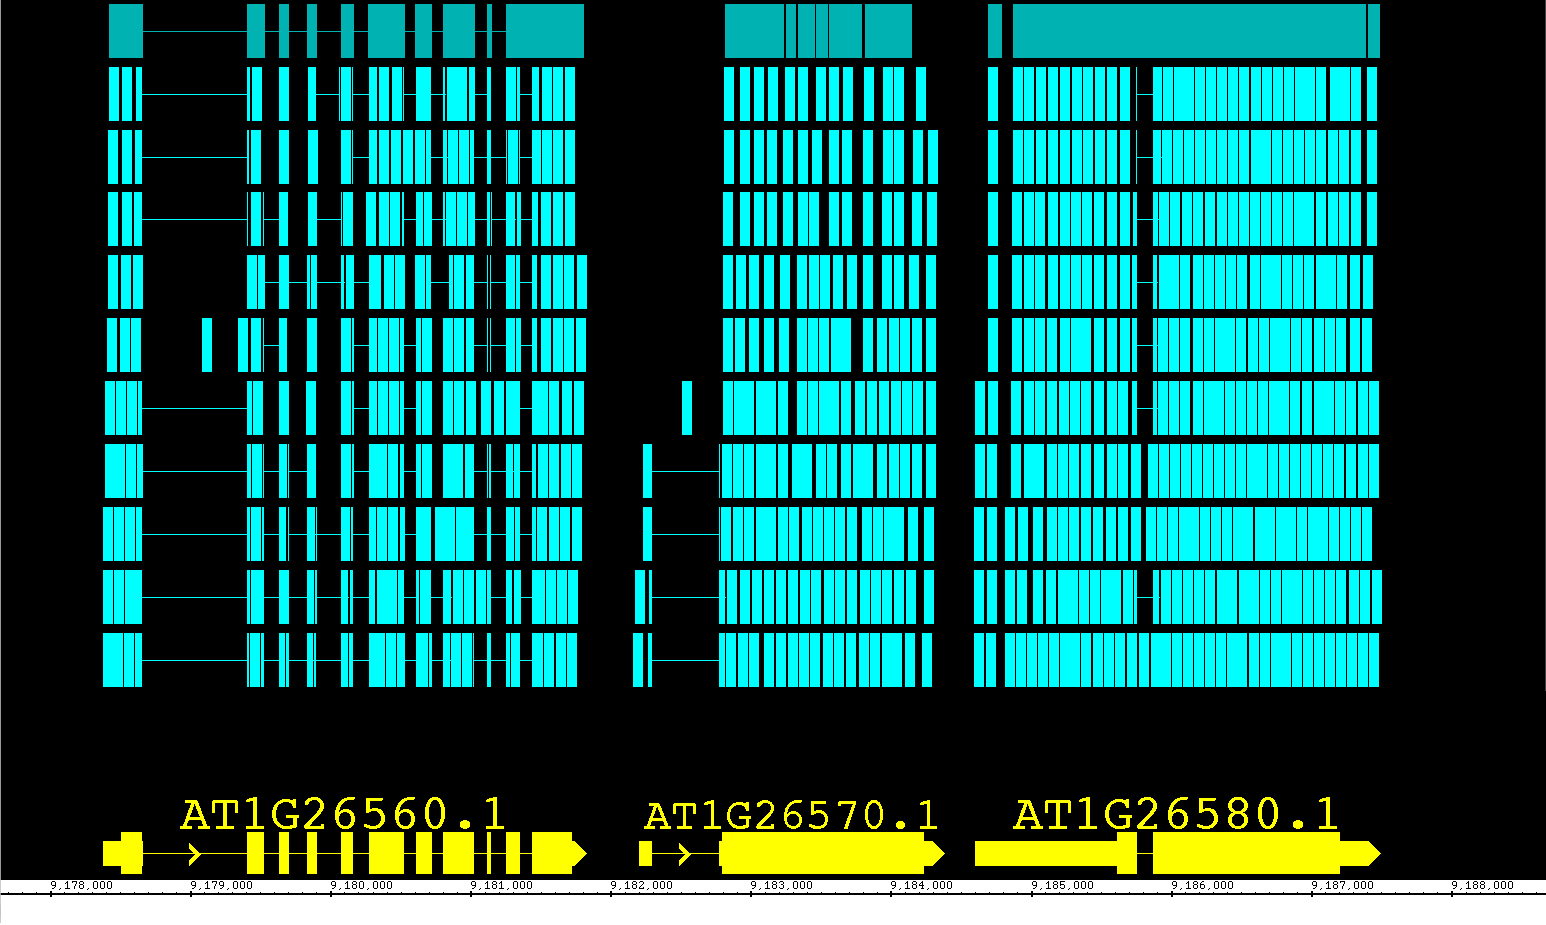
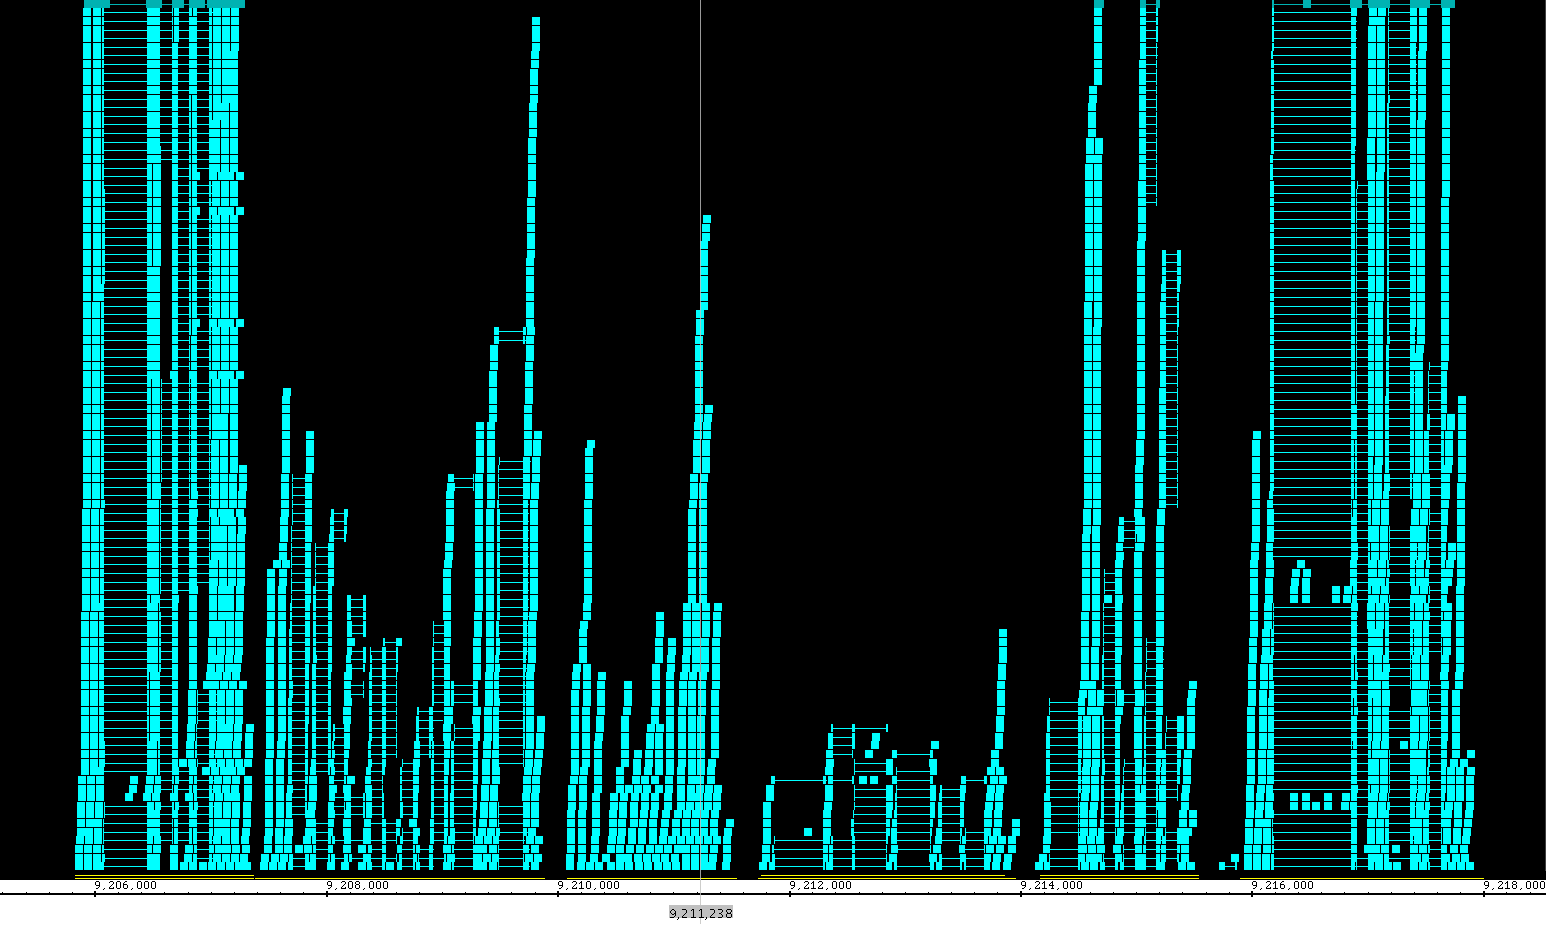
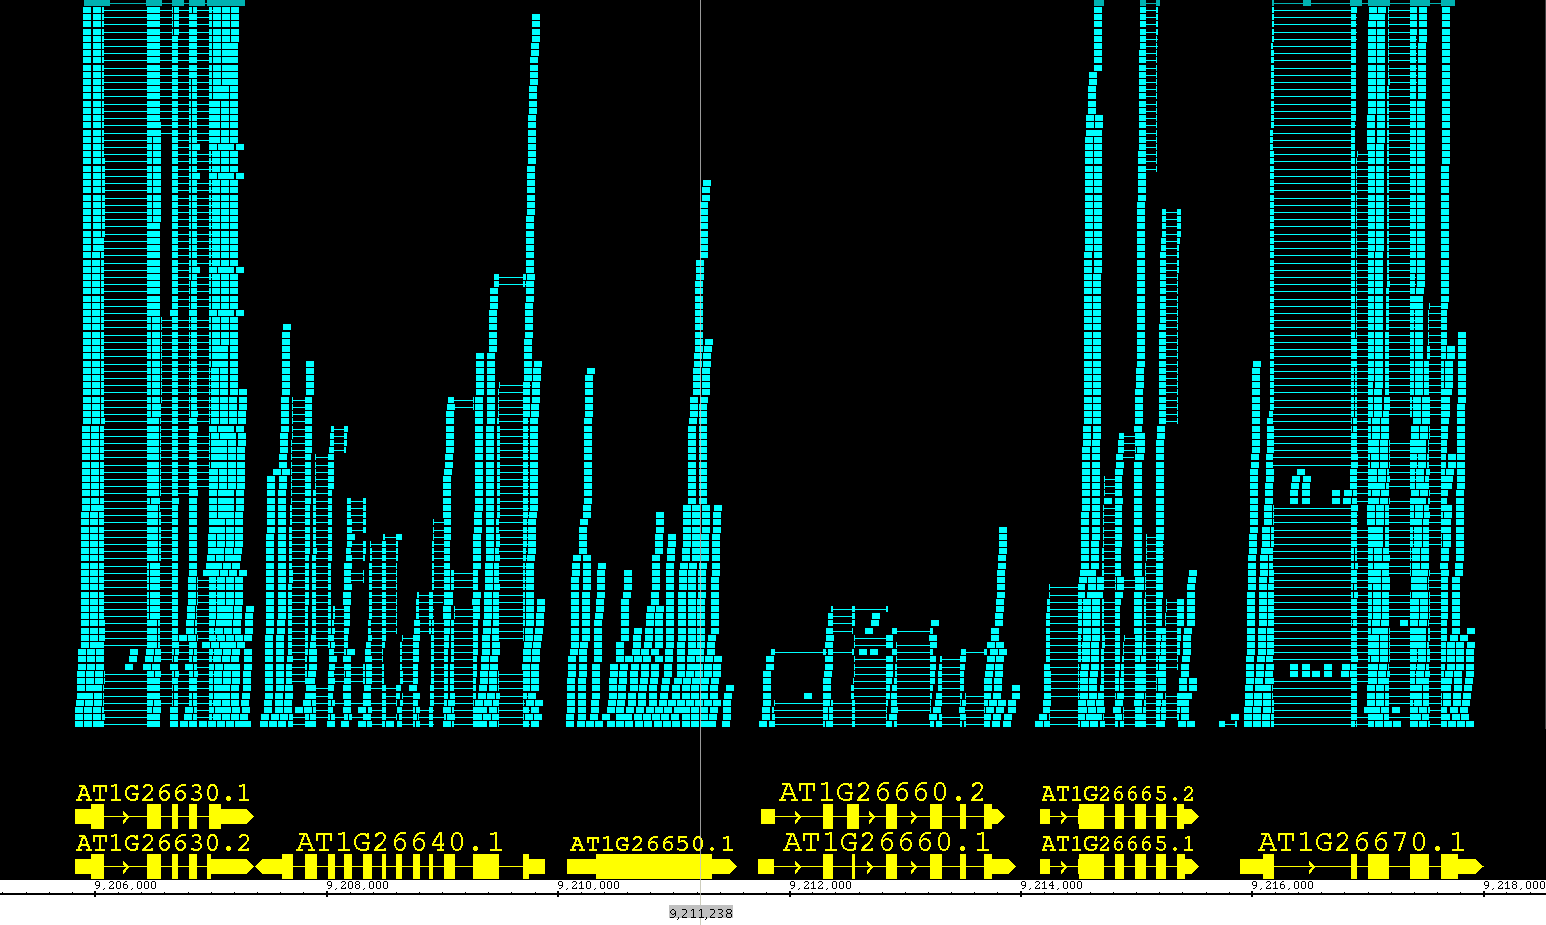
In the pictures below you can see a common situation, where a short reads file (BAM) overwhelms the reference sequence models. In the second picture, you can see the image readjusted by simply increasing the height of the ref seq track.
Improvements to Search
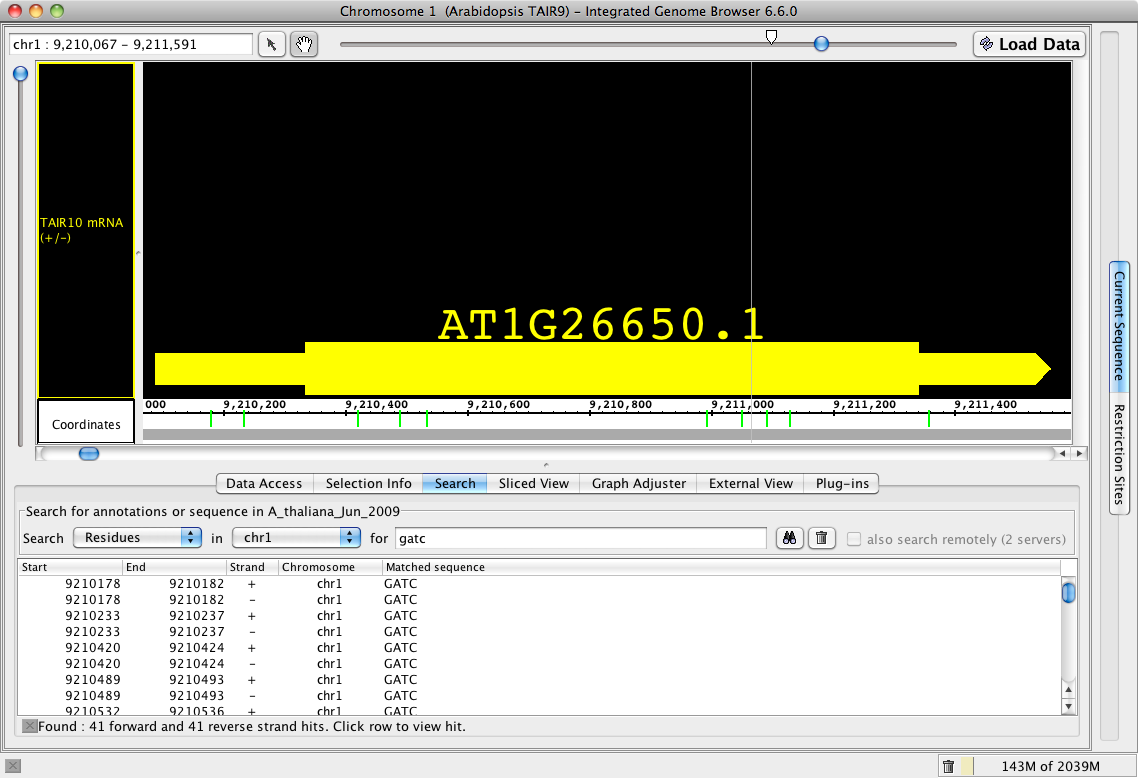
Now when using the Search tab for sequences, IGB provides a tabular output in the Search panel as well as more visible (green) hash marks on the sequence bar. A search that might be running too long or was incorrectly entered can be stopped using the X box below table.
New Features for Graphs
Our new Mismatch Pile-up (described in View Mode) graph shows both the Depth AND Mismatch graphs as one over-layed graph, and is readily adjusted by using the Graph Adjuster tab. We also have redesigned the Manipulations portion of our Graph Adjuster tab to accommodate the functions provided by Plugins. Three new Plugin functions include Geometric Mean, Power Transformation and Inverse Transformation; after installing from the Plugins tab, these functions can be found in the Transform drop down box.
New File Types, Faster Performance
With more and more data being present in more and more formats, we have expanded the types of files IGB can accept; users can load SAM files (with or without matching index files), fasta files that have been indexed and traditional BED, PSL, SAM and WIG that have been indexed using tabix. After installing the appropriate Plugins, IGB can additionally use BigBed, BigWig and VCF formats. We have made many behind the scenes changes to speed up file handling, but we now also permit the user to prioritize the order in which IGB queries servers for data; this can allow IGB to preferentially go to faster servers first OR to get sequences from a preferred server (Preference > Data Sources).
Improved Bookmarks
We have added two new features to Bookmarks. We have activated tooltips for bookmarks, so that you can find the chromosome and nucleotide range for each bookmark without needed to open it. We have also introduced a History function; using the 'fast forward' and the 'rewind' buttons in the Bookmarks tab, you can scan back and forth through your bookmark browsing history, letting you go back for a second look, without losing your place.