...
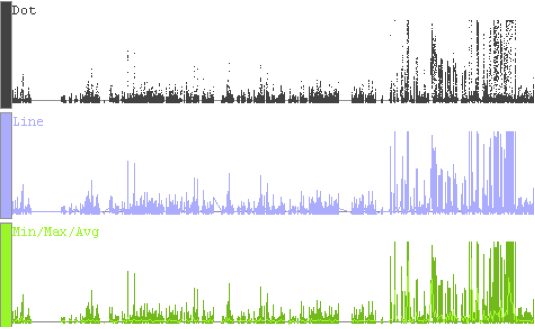
Due to the high zoom level in the above image, the Min/Max/Avg graph style is displayed exactly the same as the Bar style. When zoomed out, it reverts to showing the minimum, maximum and average values of all the data in the whole range of coordinates under each horizontal pixel width.
Change graph color
To change graph color, like chaning changing graph style, select graph, then use the color boxes in the Style panel.
...